The TOSSD data visualisation tool permits to access the data in a powerful, yet easy to use, manner. Users can filter the data, produce alternate visualisation options, download charts, and export the activity level data with all the available details. The tool presents data in absolute values for Pillar I, Pillar II and mobilisation. When the SDG filter is enabled, data are presented as shares, and only Pillar I and Pillar II data are displayed. To query the data, please follow these steps:
1. Define your selection
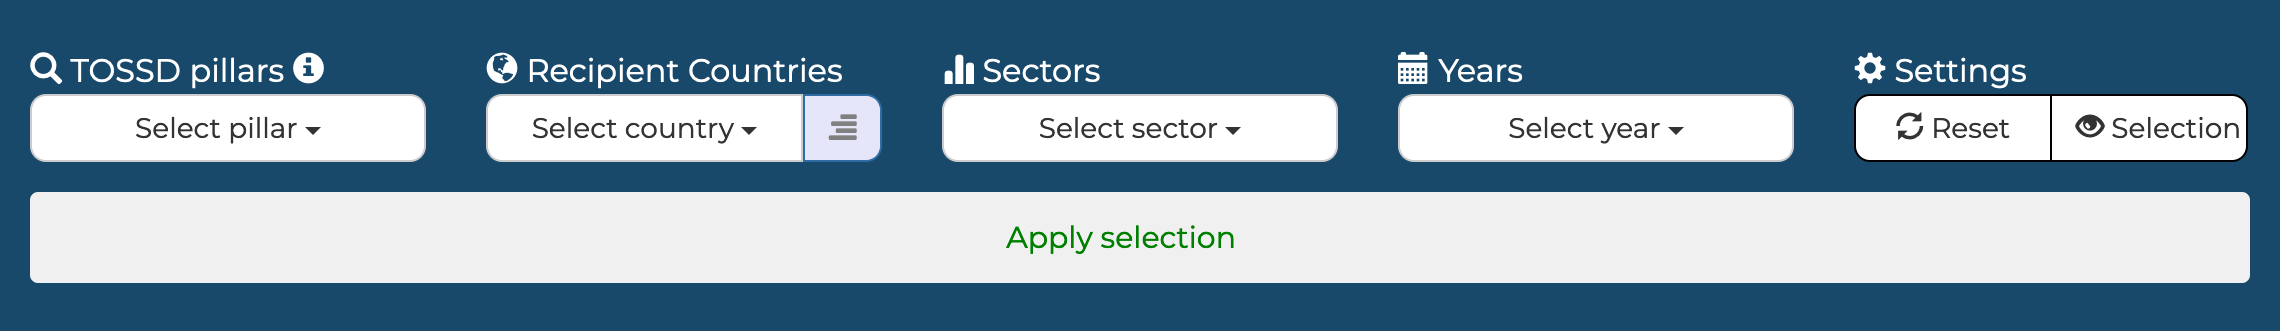
Select pillar(s), recipient(s)*, sector(s), year(s) via the dropdown menu.
(*) For Recipients countries, you can click on  to browse a strutured view
Click on the [ Apply selection ] button to visualise the selected data.
 empty the selection.
 show/hide the current selection
(The text can be copied and pasted in another document for reference).
2. Explore the data

The Pillar view
by default showcases the absolute amount for Pillar I, Pillar II and mobilisation.
The Sector view
by default showcases the absolute amount by sector, under two alternate sector classifications.
The Recipient view
by default showcases the absolute amount by recipient in descending order.
The SDG view
by default showcases the shares for each SDGs. It allows to restrict visualisation to the data identified with one, or more, SDGs. The SDG data can be further visualised by pillar, sector, recipient etc.
Please note that:
- SDG data are presented exclusively as shares, and not in absolute amounts. The shares represents the percentage of resources allocated to each sustainable development goal, over the total resources allocated. Each TOSSD activity could be reported with more than one SDGs or target, therefore the sum of the shares for all SDGs is higher than 100%.
- SDG data are presented only for Pillar I and Pillar II, not for mobilisation.
When the SDG goals and targets tab is selected:
an overall view of the shares of TOSSD attributed to each SDG is shown (be sure that all SDGs are selected in the SDG filter). The chart shows the share of TOSSD attributed to each SDG.
Furthermore each column indicates the share of activities allocated exclusively to one SDG (darker shade), and the share of activities allocated to multiple SDGs (lighter shade).
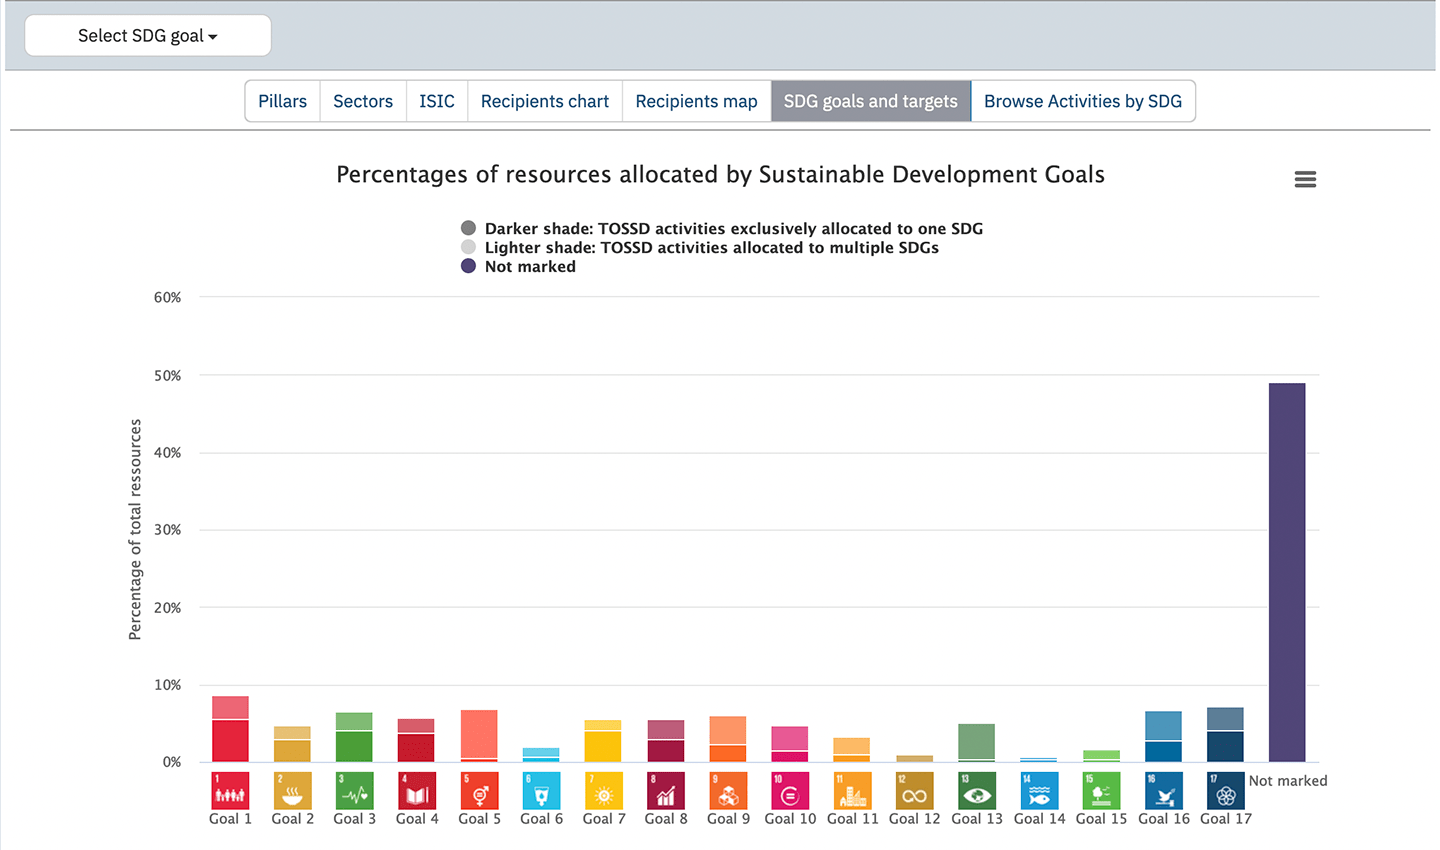
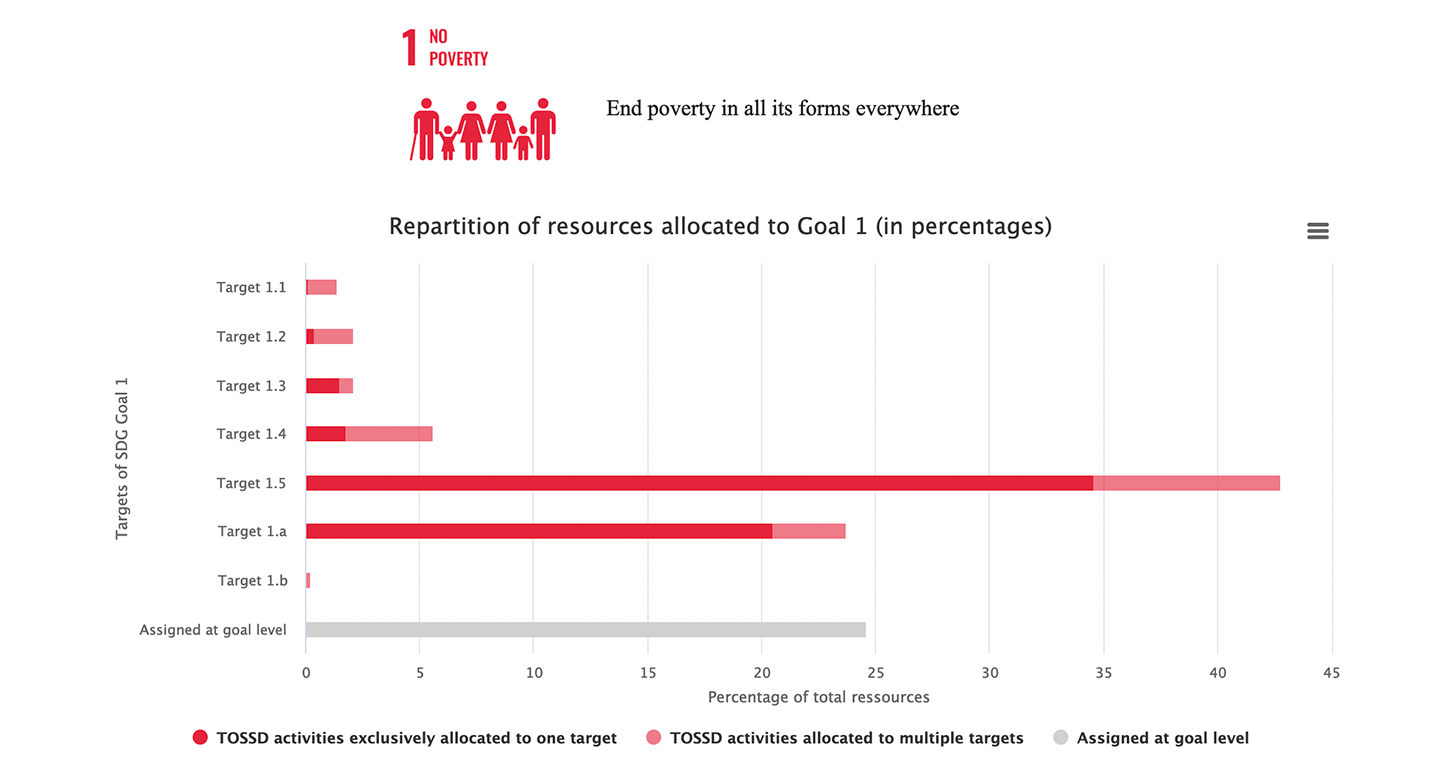
By clicking on any of the SDG bars, the related visualisation by target is shown, showing the shares for each target, and the shares assigned at the goal level. These shares are also shown with a darker shade if exclusively allocated to one target, and with a lighter shade if allocated to multiple targets.
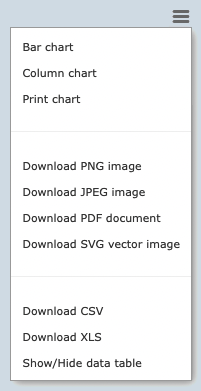
Bar (Columns) charts
Pillar I, Pillar II and Mobilisation can be selected or deselected on the fly clicking on the legend on top of the chart.
Alternative charts and export options can be selected by clicking on the right side menu
Map charts
Click on a country bullet display additional informations
3. Browse (and Export) activities to access the detailed list of activities

By default, a list of activities appears on the screen, and can be downloaded ("export results") in Excel or other formats. Some activities activities are disseminated in a semi-aggregate form pending confirmation by providers on the level of disclosure.